I believe in data. I use data when teaching trial advocacy; and when there are no supporting data for a thesis (think, for example, of the claim that 80% of trials are decided at the end of the opening statements) I debunk the claim. We propagate too many myths as if they are eternal truths. But now I find I may have been guilty of committing that sin when discussing the power of visual imagery.
Here’s how. For years I have relied on visuals such as the one pictured here to support the claim that a visual ‘cements’ a memory into place and is retained much more than when information is received only aurally:
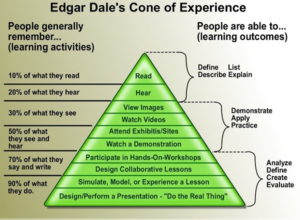
This chart is actually conservative – it posits that we retain 50% of what is being presented when words are combined with pictures, while some claim the retention rate is 60%.
This was truth – with numbers – until I read Subramony et al, The Mythical Retention Chart and the Corruption of Dale’s Cone of Experience, Educational Technology , November-December 2014, Vol. 54, No. 6 (November December 2014), pp. 6-16. How was I wrong?
The authors became history sleuths. They carefully trace back the lineage of this claim and find that there is no foundational research supporting it. Put more simply, someone wrote about this and then a later writer assumed there were substantiating data. Indeed, there was some research to the contrary. Here is a sampling of what data-based research demonstrated:
- When Fleming (1987) summarized findings about learning from visual displays, he concluded that: “Realism per se is not necessarily a virtue in instruction” (p. 242).
- “Pictures and words can be reciprocally beneficial; words can delimit and interpret pictures and pictures help define, exemplify, and make memorable words” (p. 242). But as Gagné and Glaser (1987) added: “However, it is not clear that adding images to material that is otherwise semantically well organized is always of benefit to retention…” (p. 60)
- When Barron (2004) summarized findings on learning from audio sources, she concluded that:
- In terms of short-term memory “audio information. ..is recalled better than the same information presented visually.” (p. 958)
- In terms of long-term memory, “studies have produced conflicting results.” (p. 958)
- “It seems evident that there are many variables that influence optimal combinations of audio and visual information, including the type and complexity of the information, the attributes of the target audience, and the level of redundancy.” (p. 962)
Mythical Retention, 9. Subramony and colleagues conclude as follows:
[W]e have shown that the canonical American version of the retention chart data may be attributed, very tentatively, to Paul J. Phillips, but it cannot be demonstrated that Phillips based these generalizations on any body of scientifically conducted research. Further, there is no conceivable sort of scientifically conducted research that could yield the neatly rounded increments found…
Mythical Retention, 13.
Is there no value to using visuals? Of course there will be. Using a visual ensures that the audience – in our instance jurors – have a shared image of what the presenter is detailing in words. Visuals may simplify story-telling. They avoid monotony and can be used to reinitiate primacy. And when “cueing” occurs, i.e., using a change in voice and a pointer or other tool to highlight a specific aspect of a visual, viewers “spent more time attending to the relevant portion of the graphic and performed better on posttests…” Xie et al, Coordinating Visual and Auditory Cueing in Multimedia Learning, Journal of Educational Psychology, 2019, Vol. 111, No. 2, 235–255.
So I will continue to emphasize the utility of visuals and use authors such as Edward Tufte and books like Performance Zen to assist me in choice and design. But I will not teach again using that cute pyramid or its arbitrary claims of 50% or 60% retention. I might wish that the numbers were correct, and I might intuit that they may be right in degree if not in proportion – but the science and data are just not there.